Robinsons Retail's Record-Breaking 2022 Performance Reveals the Shifting Nature of Inflation
Robinsons Retail had an outstanding 2022 in the context of the top and bottom lines. But its performance, fueled by mostly bank credit expansion, has resonated with the shifting nature of inflation.
When the firm later sells the product, the extra inflationary gain is not really a gain at all; for it must be absorbed in purchasing the replaced capital good at a higher price. Inflation, therefore, tricks the businessman: it destroys one of his main signposts and leads him to believe that he has gained extra profits when he is just able to replace capital. Hence, he will undoubtedly be tempted to consume out of these profits and thereby unwittingly consume capital as well. Thus, inflation tends at once to repress saving-investment and to cause consumption of capital—Murray N. Rothbard
Robinsons Retail's Record-Breaking 2022 Performance Reveals the Shifting Nature of Inflation
Breakthrough Sales of Robinsons Retail Echoes the Core CPI
Robinsons Retail [PSE: RRHI] is the first major retail chain to publish its 2022 annual report. Through their financial performance, we examine the health of the consumers.
The headline performance should make the bulls giddy.
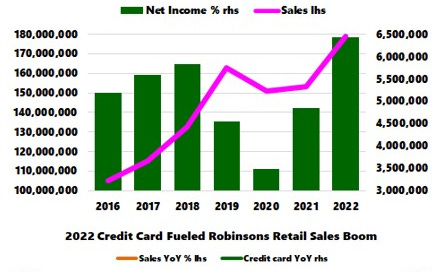
Philstar.com, February 02: In a disclosure sent to the Philippine Stock Exchange index on Thursday, the Gokongwei-led company reported its net income surged 30% year-on-year to P6.3 billion in 2022. The company’s consolidated net sales grew 16.6% on-year to P178.8 billion in 2022 on the back of same-store sales growth and new stores.
Figure 1
To add, with sales and net income hitting an all-time high, 2022 was undisputedly a banner year for RRHI. (Figure 1, upper chart)
But the question is, how was this attained? And will consumers sustain this momentum? Or, the devil is in the details.
Sure, the reopening spurred some improvements in the labor force. The Philippine Statistics Agency (PSA) reported that the employment rate rose to 95.8% in December 2022 from 93.4% in the same period a year ago, or an estimated 2.73 million entered the workforce.
But part of the employment growth emerged from or was funded with the landmark bank lending to the supply side, aside from the historic public spending. Yet, improvements in the labor force barely resonated with this incredible combination.
Instead, it dramatically energized street prices. The headline 2022 CPI of 5.8% reached a 14-year high! Meanwhile, the annual core CPI rose to 3.9%, a 3-year high, even as December 2022's core CPI of 8.1% also signified 2008 levels (a 14-year high too)!
Naturally, the financial performance of RRHI manifested these dynamics. And the core CPI is more relevant when measured against RRHI's performance.
RRHI a Beneficiary of BSP Inflation?
Here is a backstory.
With domestic assets pressured by rising rates, banks, aided by various relief measures implemented by the BSP, have taken the gauntlet to lend aggressively.
And consumers have become a focal point of bank credit expansion.
So aside from the blast-off in salary loans, bank credit card growth, which also hit all-time highs (in peso and % share), has signified the most significant force in driving demand.
It has been no surprise to us that credit card growth has mirrored RRHI's sales performance. The market of RRHI emanates mainly from the middle to the upper echelons of the wealth/income bracket. So, both (bank credit card and RRHI sales) are at an all-time high in pesos.
But the quarterly rate appears to be rolling over for credit card growth and sales of RRHI in Q4 2022. (Figure 1, lower diagram)
There is a precedent. Sales peaked in Q1 2018, a year ahead before credit card growth in Q1 2019. Will history rhyme?
Still, credit card and salary loan growth accelerated in the first two months of 2023.
Figure 2
But RRHI appears to be a beneficiary of the monetary inflation.
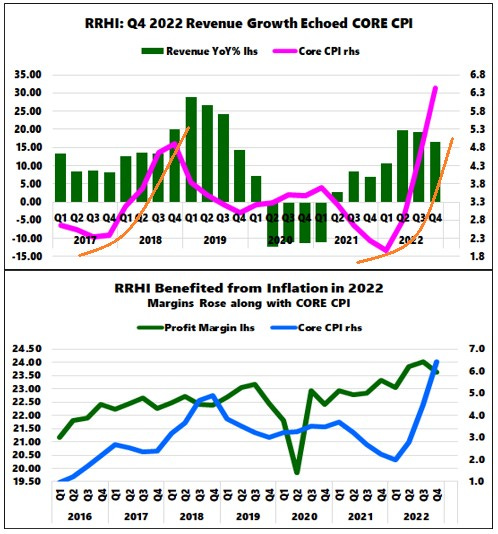
Revenue growth has resonated with the undulations of the core CPI (in 2017-2018 and today). (Figure 2, higher chart)
Profit margins have also expanded on the spurt of the core CPI, which implies that their customers absorbed the firm's pass-through of price increases. (Figure 2, lower window)
The Dominance of Department Sales Reveals the Shifting Nature of Consumer Preference and Inflation
Since the retail chain has diversified segments, 2022 performance not only exhibited the variability of the rate of change but also revealed the changing consumer preference.
Figure 3
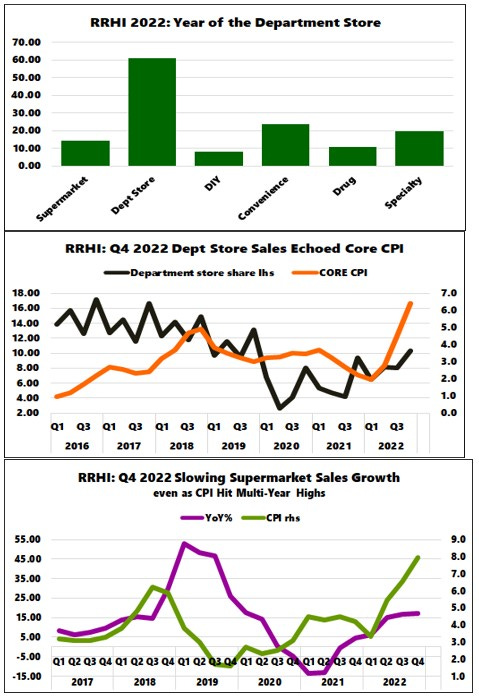
In 2022, the 67% sales growth of the department store segment signified the hands-down winner. (Figure 3, topmost window)
The nearest contenders were the convenience and specialty chains, up 23.5% and 19.5%. Nonetheless, sales of all departments (supermarket, DIY, convenience, drugs, and specialty) were higher in 2022.
As a share of the aggregate, after hitting a nadir in Q2 2022, department store sales steadily rose through the ranks. In the meantime, beneficiaries of the pandemic, the pie share of the supermarket and drug departments fell. Although the specialty segment bounced in Q4 but has been rangebound since Q1 2021, the rest of the departments have declined.
More pointedly, department store sales singlehandedly trounced the other segments.
The growth of department stores, which represents non-food consumer goods, has resonated with the core CPI. (Figure 3, middle chart)
On the other hand, supermarket sales, representing necessities and the largest share of the total sales, climaxed in Q1 2019. It bounced from its trough in 1H 2021. However, while its growth rate appears to have tapered in 2H 2022, supermarket sales still had a blistering 17.4% in 2022.
Yet, the growth rate of supermarket sales appears to have diverged from the headline CPI. (Figure 3, lowest pane)
From the lens of RRHI, the shift towards department store sales exhibits the dynamic character of consumer preference. Importantly, it reveals the changing nature of credit-driven (demand-pull) inflation.
Nota Bene: other non-food products of RRHI also are part of the core CPI.
RRHI’s Rising Debt and Financial Expenditures
Another point of interest is RRHI's debt and financing charge.
Figure 4
Seen from a quarterly perspective, after the recent low in Q1 2022, its debt stock began to rise in Q2 and pushed higher in Q4. (Figure 4, upper pane)
And interest expenses, after having peaked in Q1 2021, have dropped since. But it appears to have regained an upside momentum in the 2H of 2022, helped by the rate hikes of the BSP in response to the CPI at multi-year highs. (Figure 4, lower chart)
Perhaps part of this debt uptake is to fund its recently acquired 4.4% stake in BPI and its proposed 200-store expansion this year.
Nevertheless, it should be interesting to see how "fundamentals" will turn out when interest rate hikes combined with high levels of debt—in the face of the material erosion of the peso's purchasing power—take a bite on the consumer's balance sheet.
Our humble guess is that this won't end well.


